
#SharedPride 🌈 Day 4: Queerness stats...
Daily Queer resources & ideas for our classes all June long!

Statistics show up for our classes in all sorts of places, not the least of which are tasks asking learners to describe or summarise information from a chart or graph, like on IELTS. It comes in handy when providing evidence for a research paper in EAP, too. It’s also just informative to drive a point home when we create an effective graphic too. All these uses can easily include sexy data about LGBTQ+ community.
Day 4 🏳️⚧️ …In sexy graphs
I’ve come across a number of reports about LGBTQ+ folx in the time I’ve been talking more about us in education. Sometimes the data is just black and white in a boring chart. Other times—thankfully—designers make their charts reflect the diversity of the questions: how can this data be presented both beautifully and clearly? Here are just a few examples that do so in a variety of ways. Plus, these different styles can be good practice for learners to describe and summarise, or as a model for their own data reporting from those small-scale research projects we ask them to do. For example:
Rainbow Map (2025) ranks 49 European countries on their respective legal and policy practices for LGBTI people, from 0-100% and if you click on any of the countries, it gives more specific scales that contributed. Get your students to explore all this data and report back! Let’s take a look at them all, then if I clicked on #1, Malta.
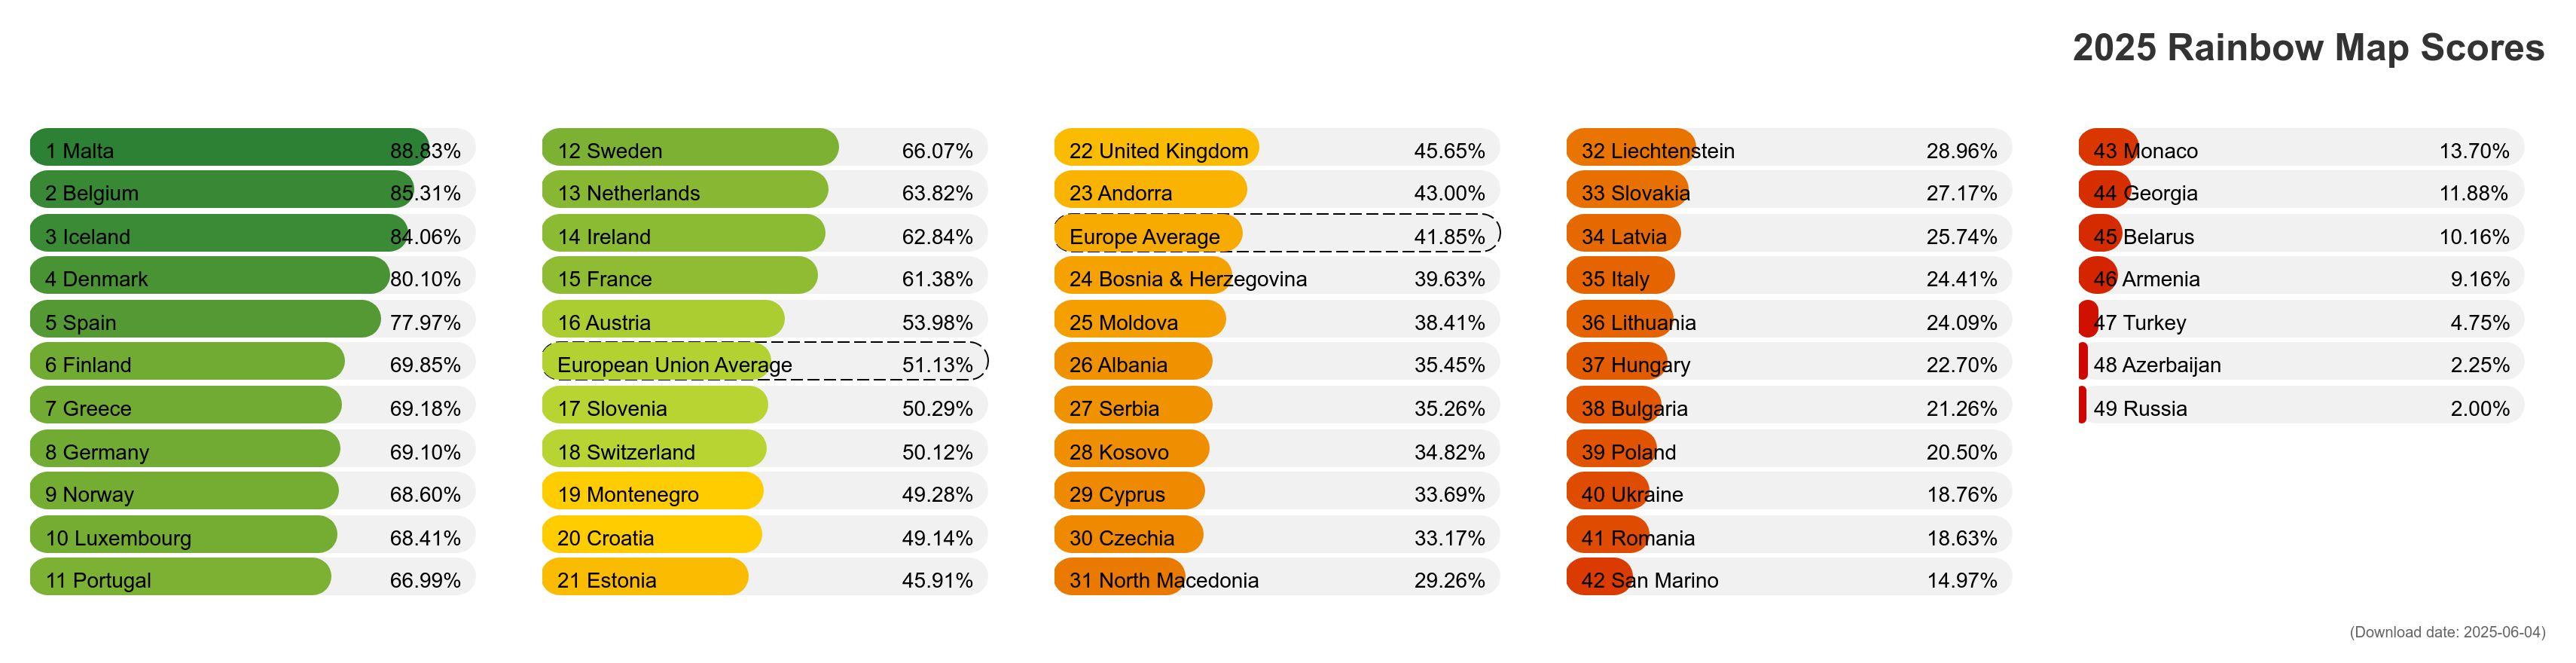
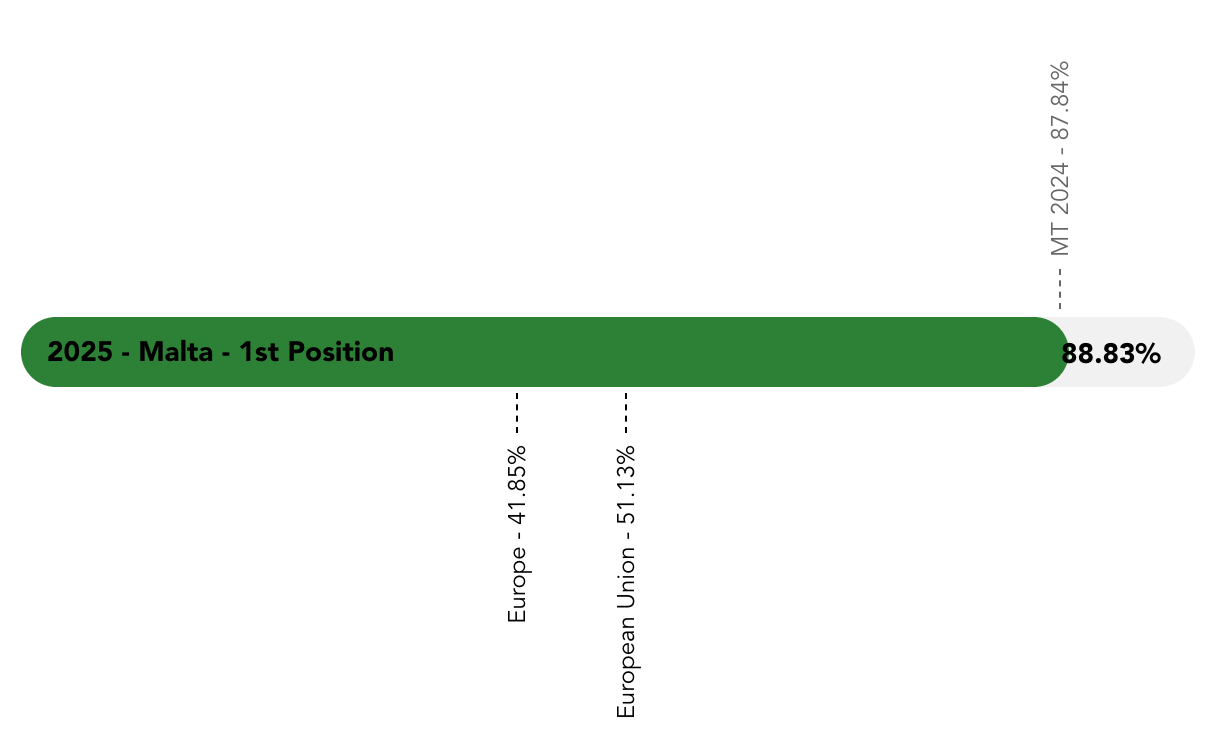
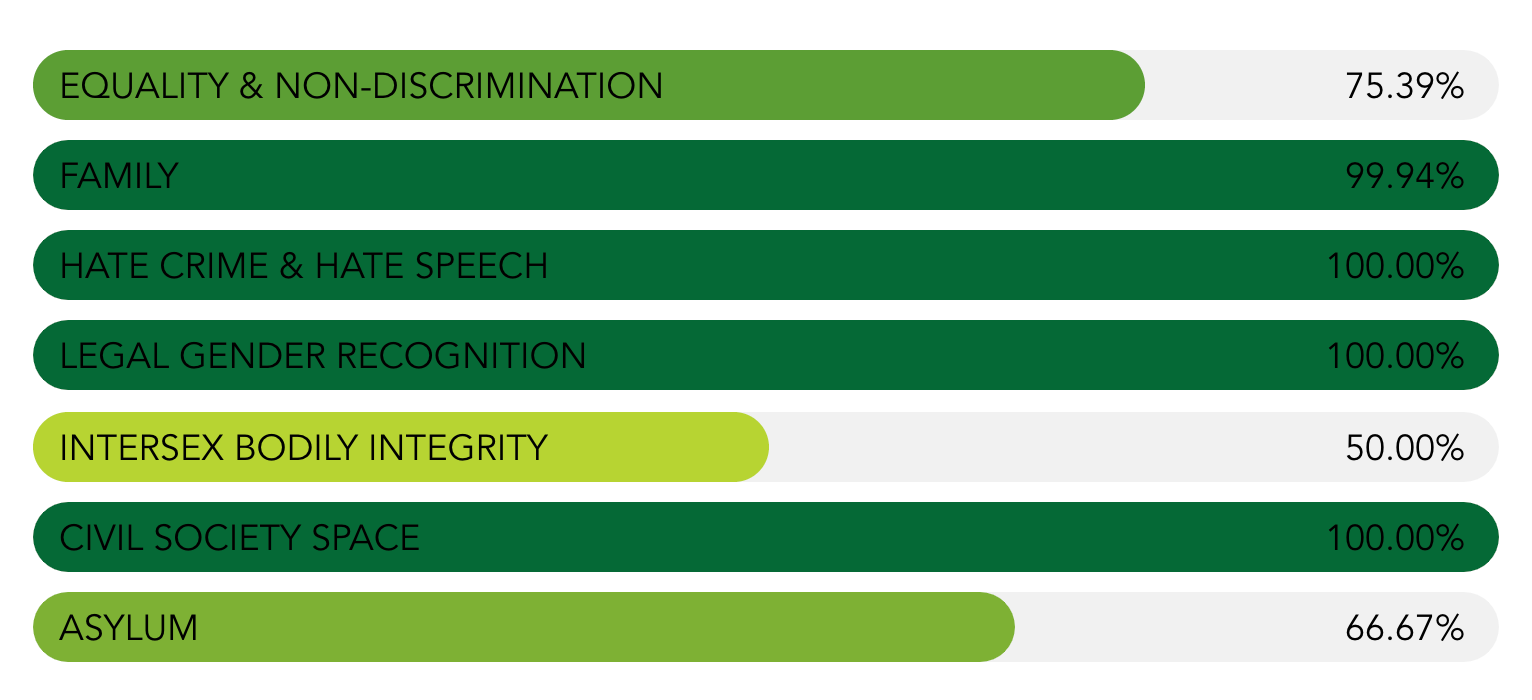
(Aside: Way to go, Malta 🇲🇹 — one of my favourite countries; now I know why. Gay!)
Next up are just a few revealing graphics that get the point across. Obviously, for more context, it behooves you to go read the report itself, but in the mean time, feast your eyes.
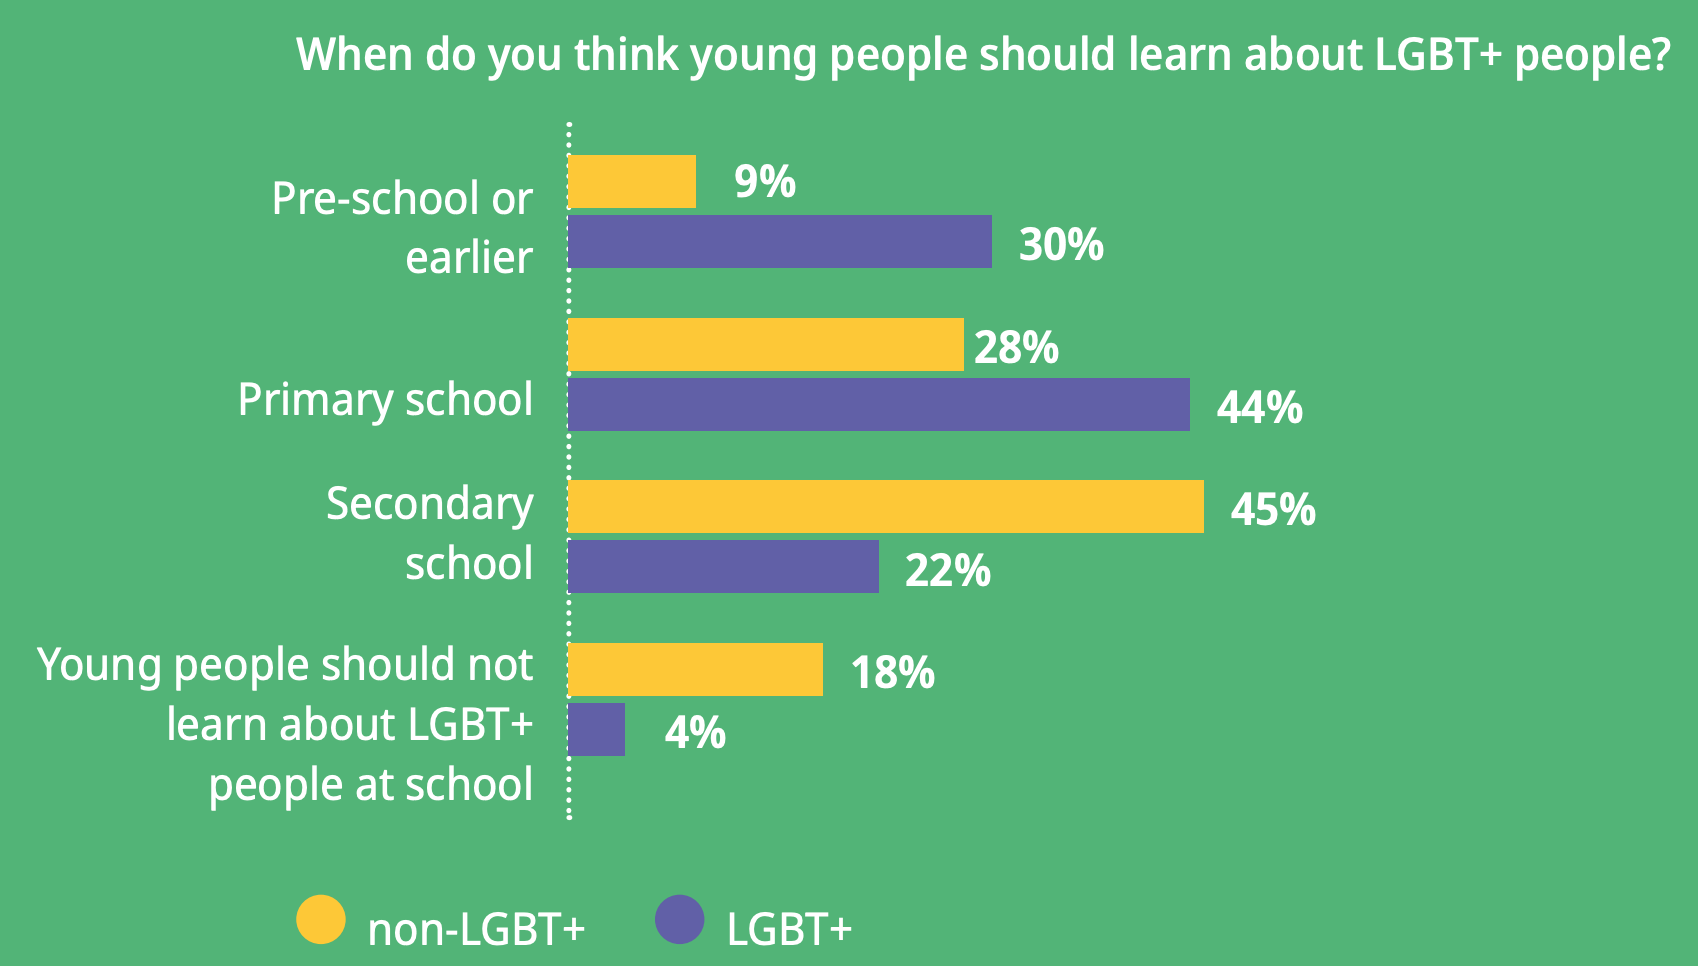
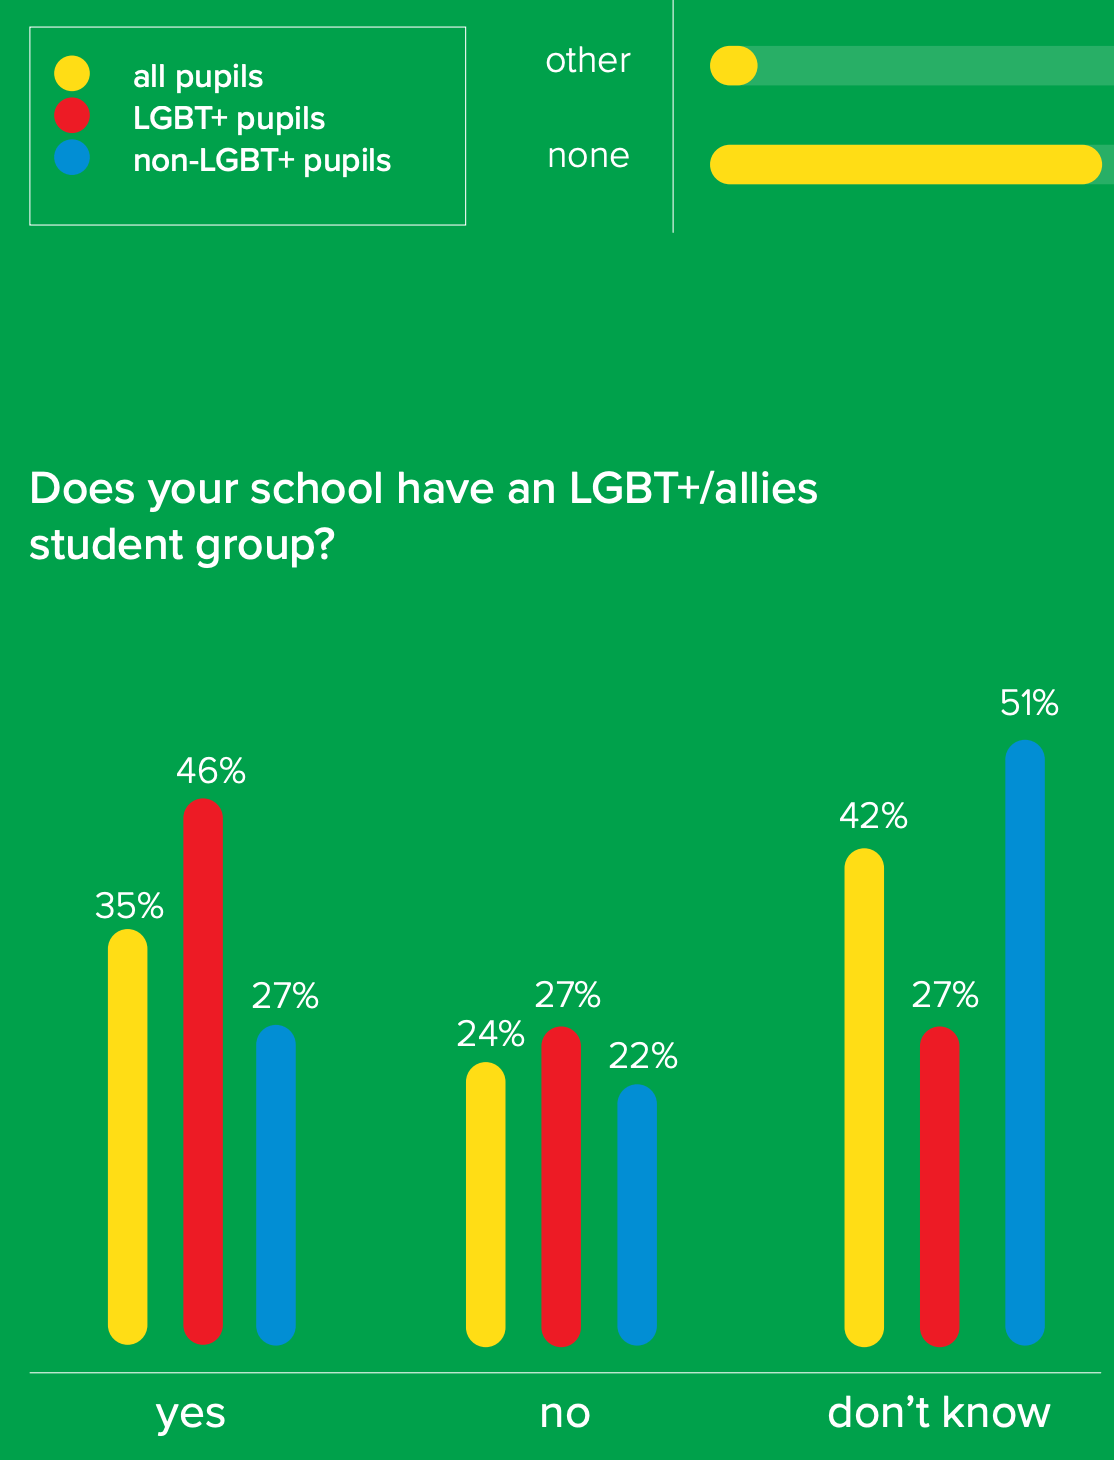
Just Like Us (UK) - Positive Futures Report 2023
Disclaimer: I’m a bit tied to English-language reports and this UK organisation is especially good at design, so acknowledging now how UK-centric the first three examples are. 😬

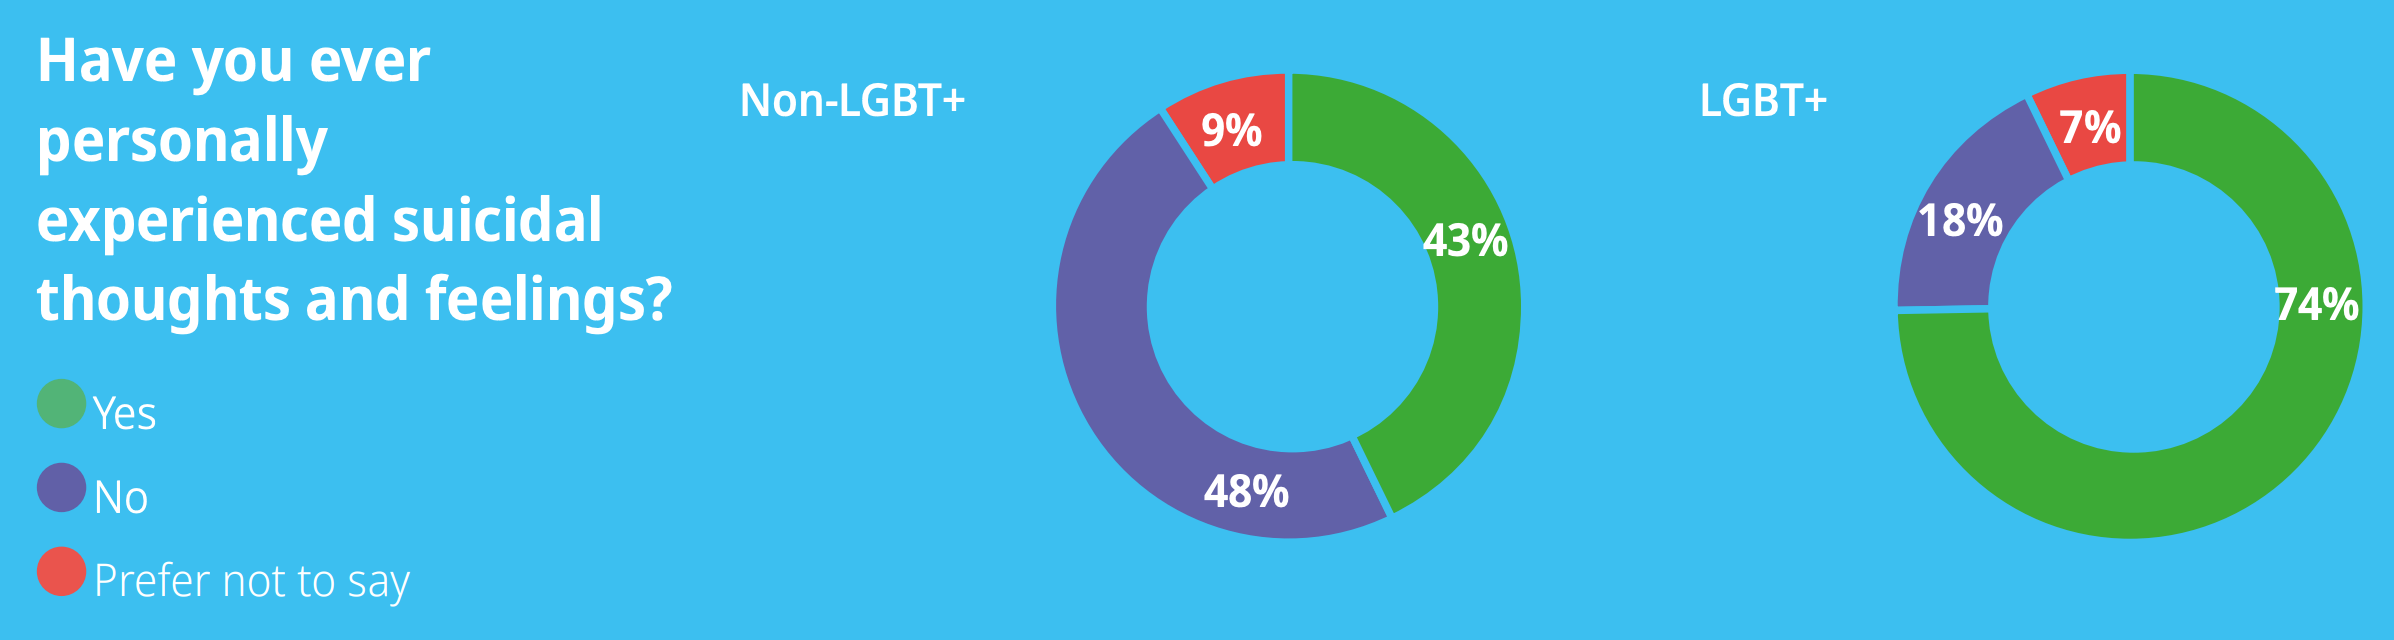
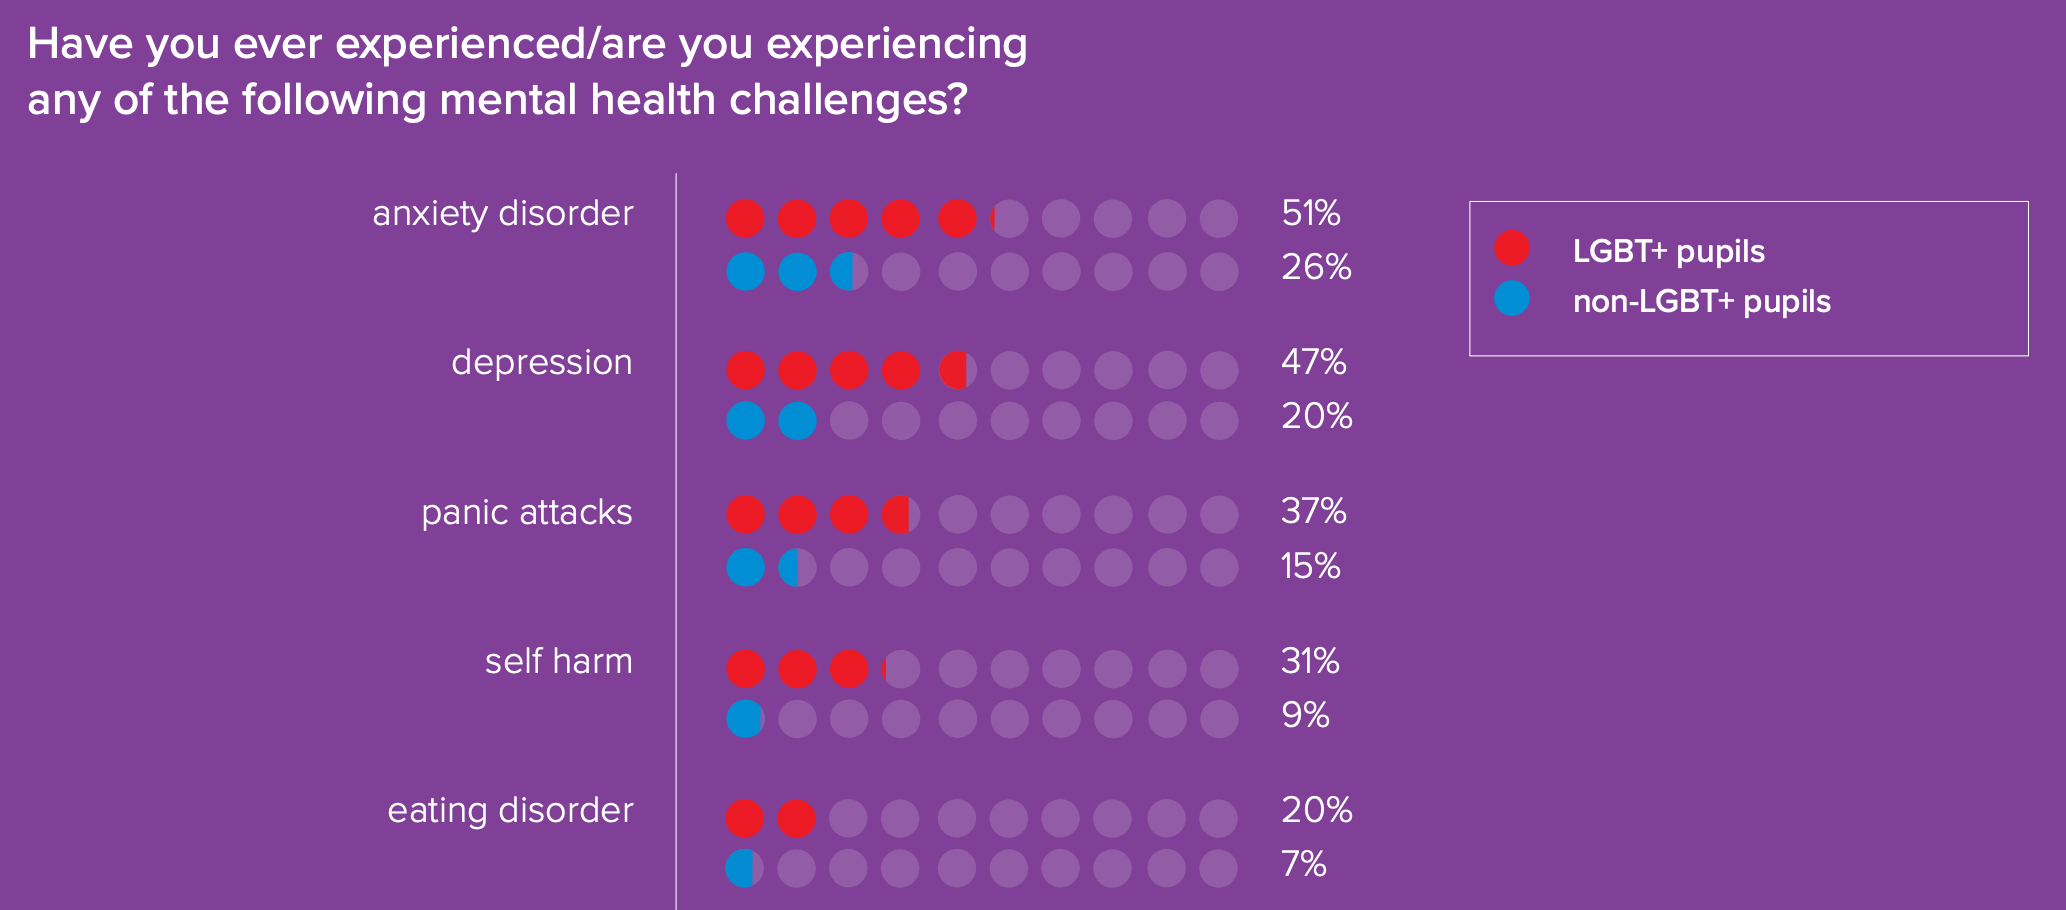
From Just Like Us (UK) - Growing Up LGBT+ (2021):
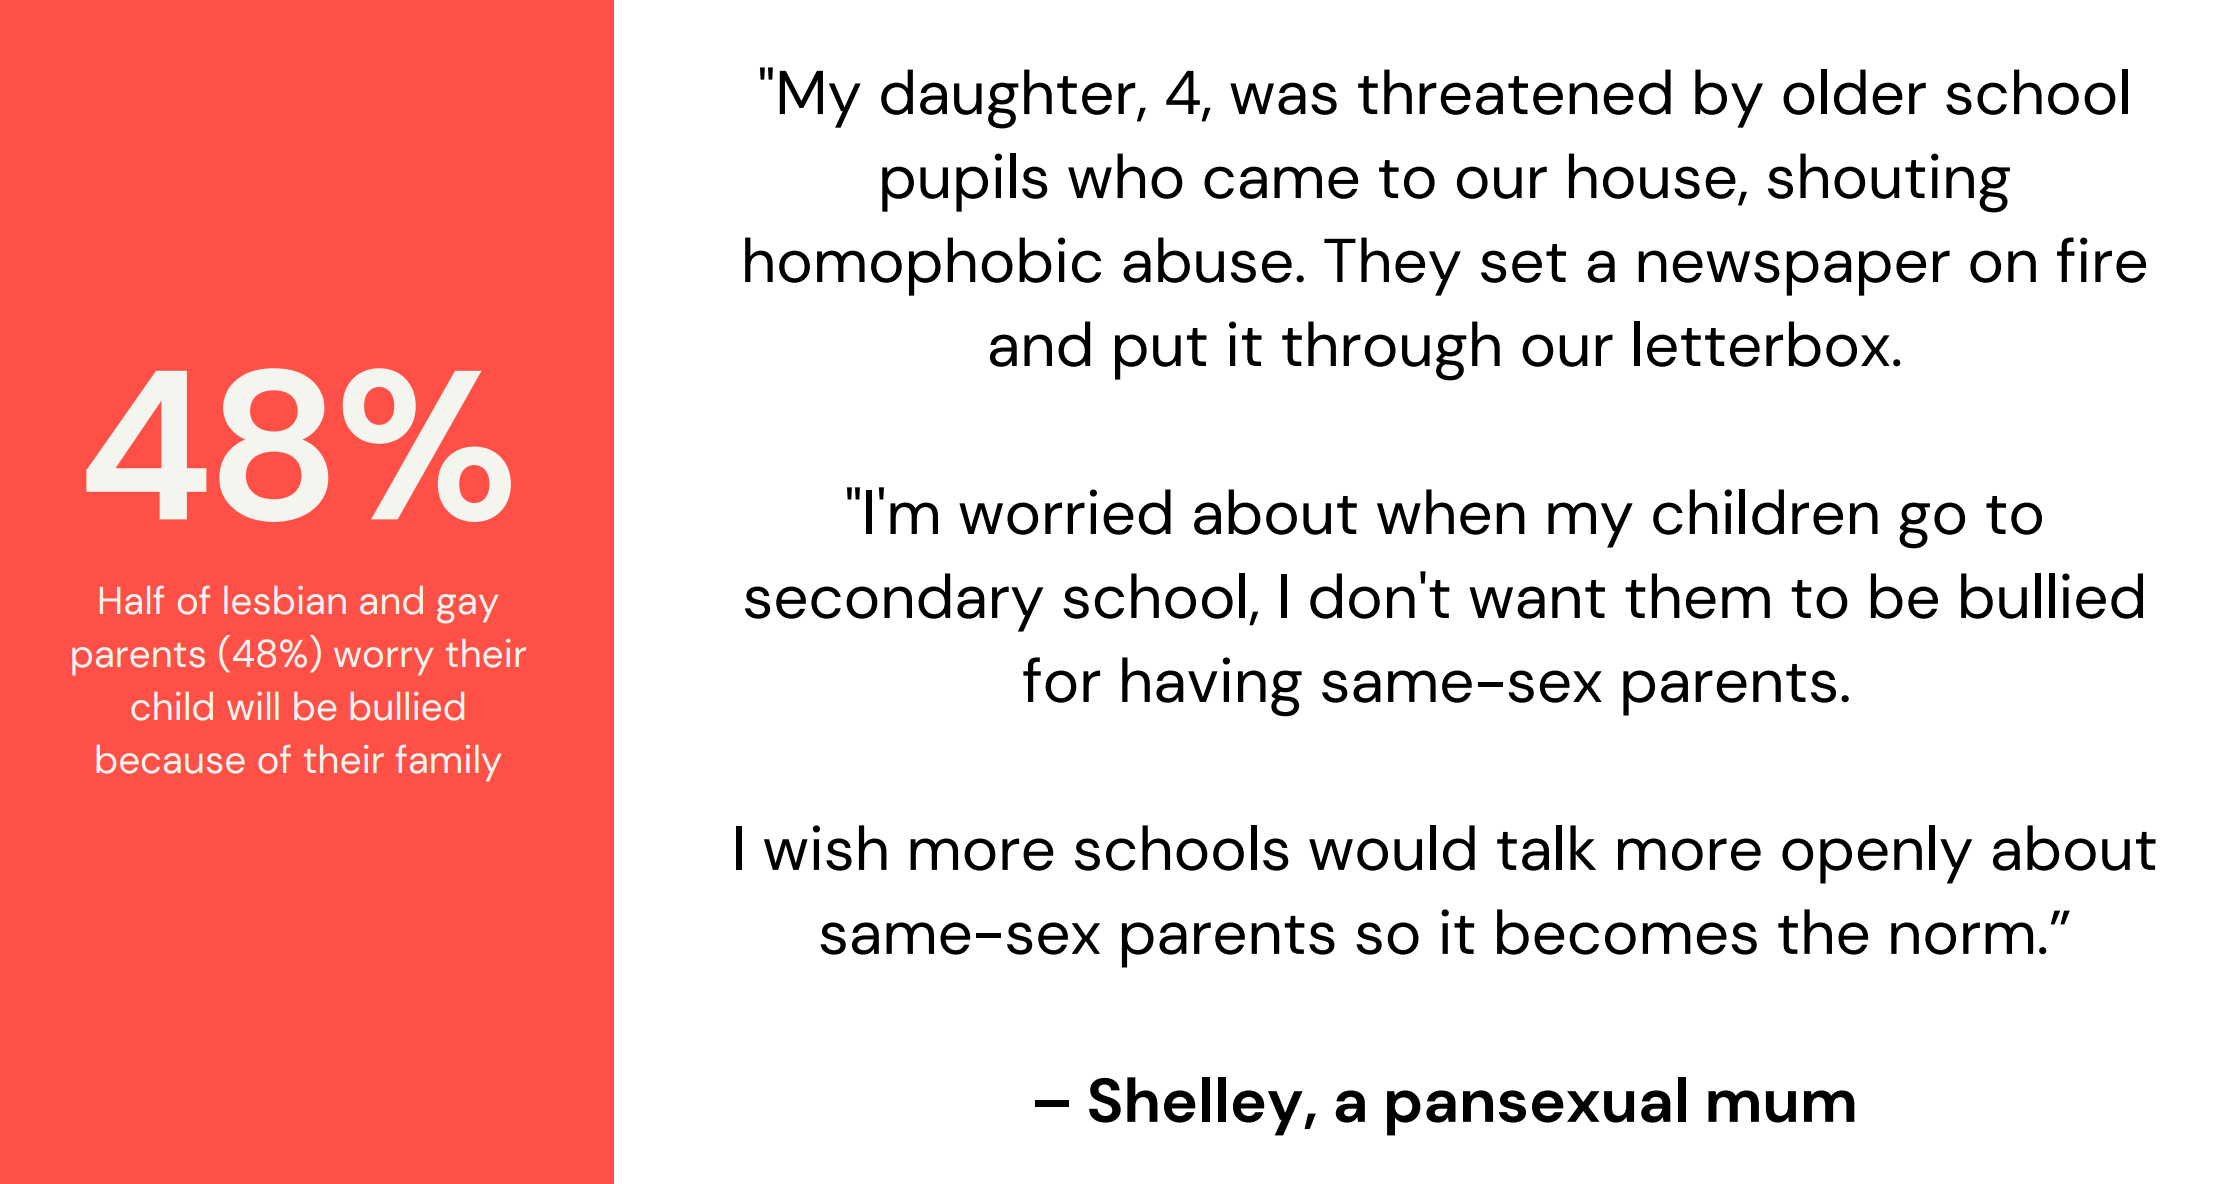
From the Just Like Us (UK) - LGTB Parents Report 2024:
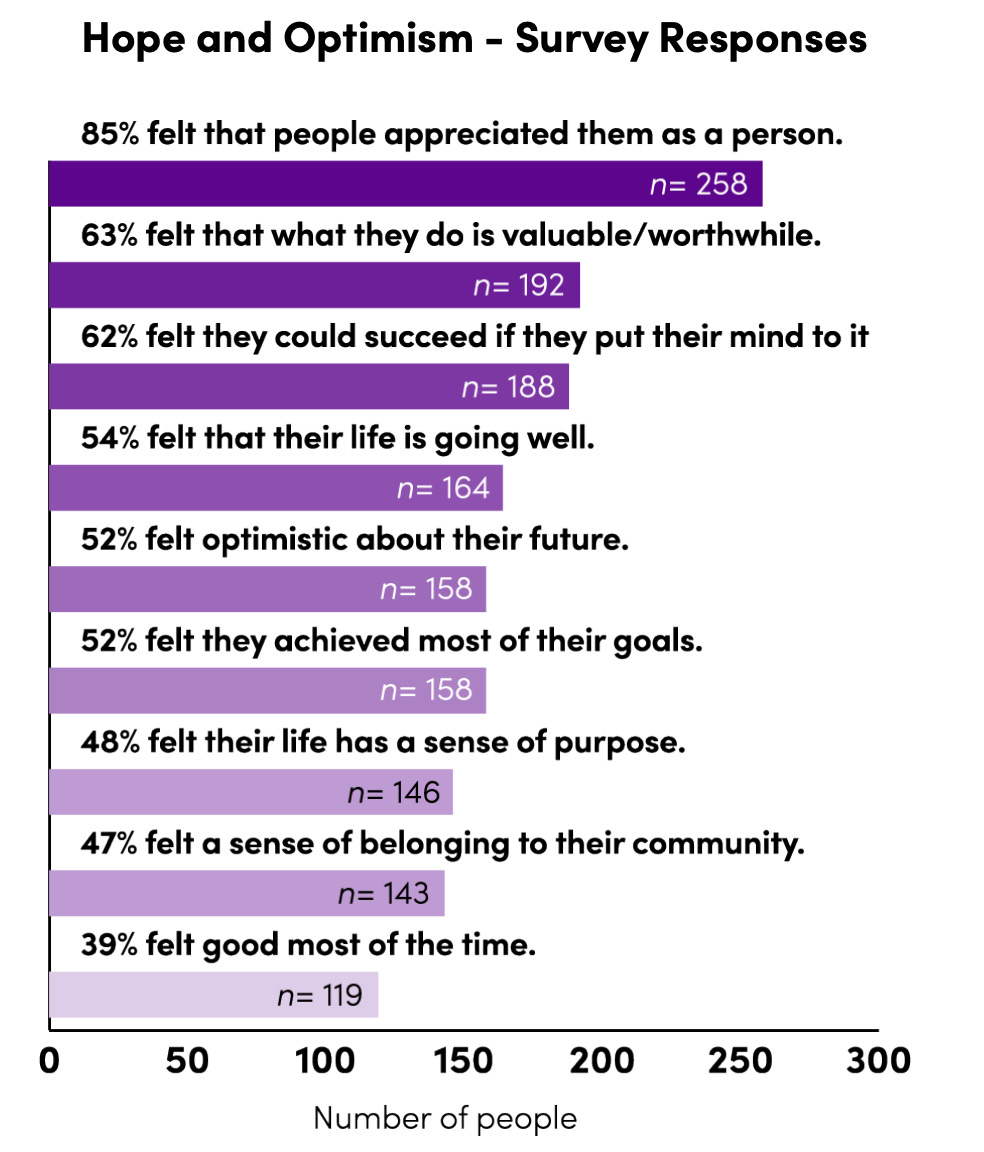
Egale (Canada) - Queering Mental Health in Canada (2023)
PURPLE. That is all.
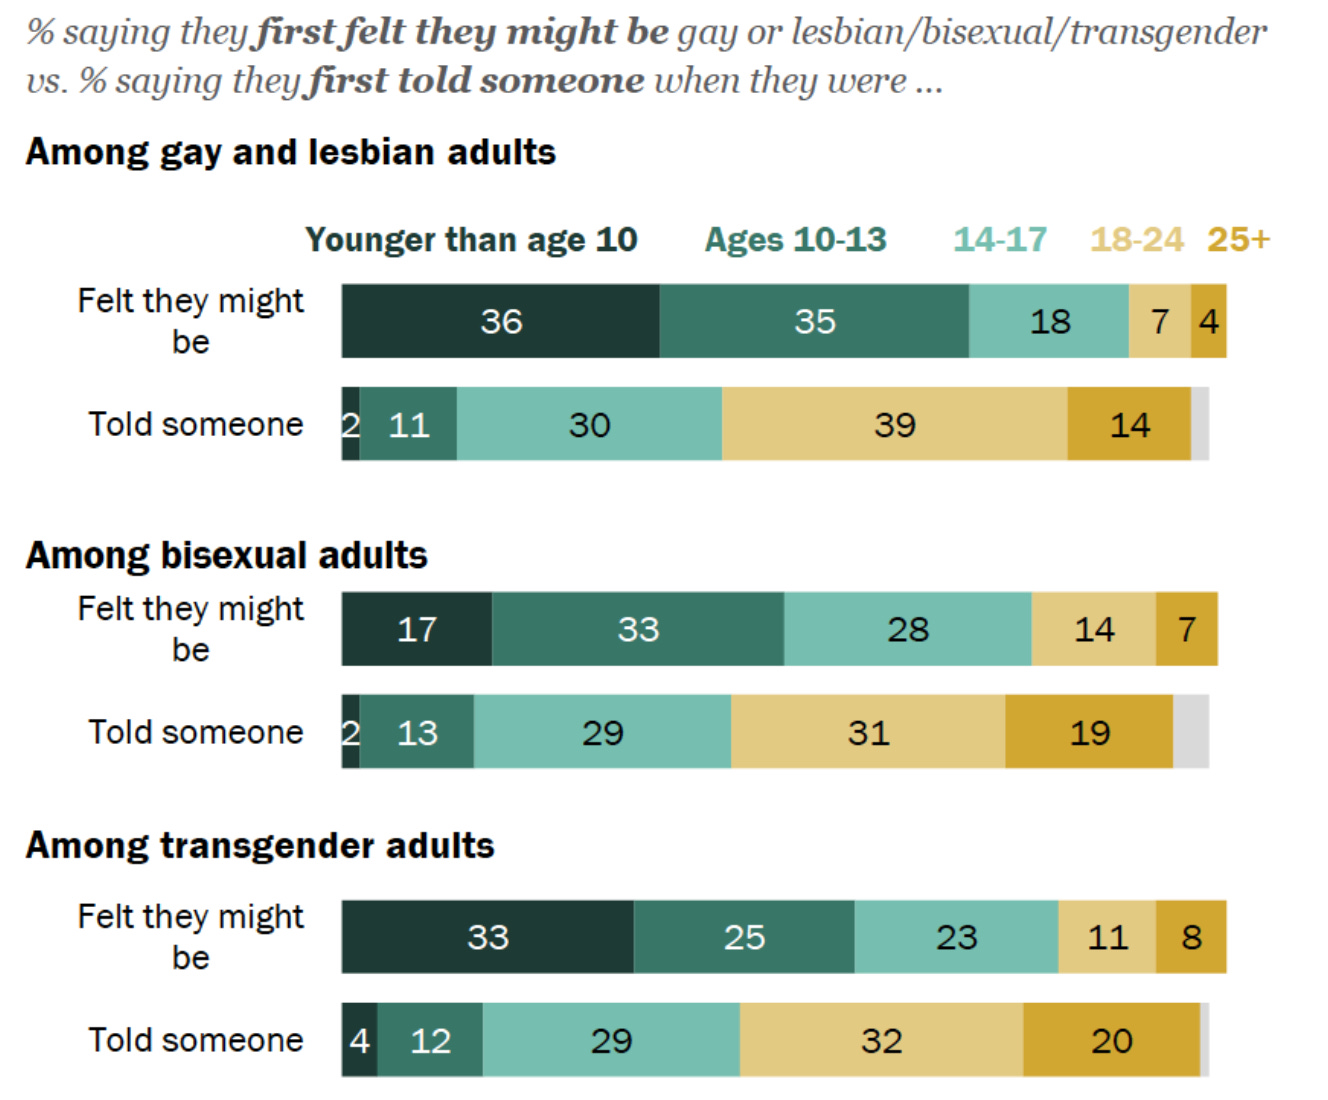
Pew Research - The Experiences of LGBTQ Americans Today (2025)
OK, I admit that this one’s a little less… attractive, but still revealing and it’s a different style of chart than the others above, so… #variety.
Question for you: Have you found reports on and from within the Queer community where you teach? Do you have examples of sexy beautiful data from other places in the world? I’d LOVE to see… and steal… and use in class… and thank you. Do share them in the comments!
#HowToInclusive 🏳️🌈 #QueeringELT 🏳️🌈 #LGBTQinELT 🏳️🌈 #SharedPride